Industrial IoT Case Study

Industrial Equipment Monitoring and Failure Prediction

Single-page Vue.js app and Node.js backend that visualises live sensor data and predicts equipment downtime before it happens. Real-time charts via Socket.io and D3.js for engineers and teams worldwide.

Services provided
  • Vue.js
  • Node.js
  • D3.js

Real-Time

Live sensor data streamed via Socket.io

Understanding the problem

The Challenge

Industry Industrial IoT
Engagement Frontend-Led
Started 2018

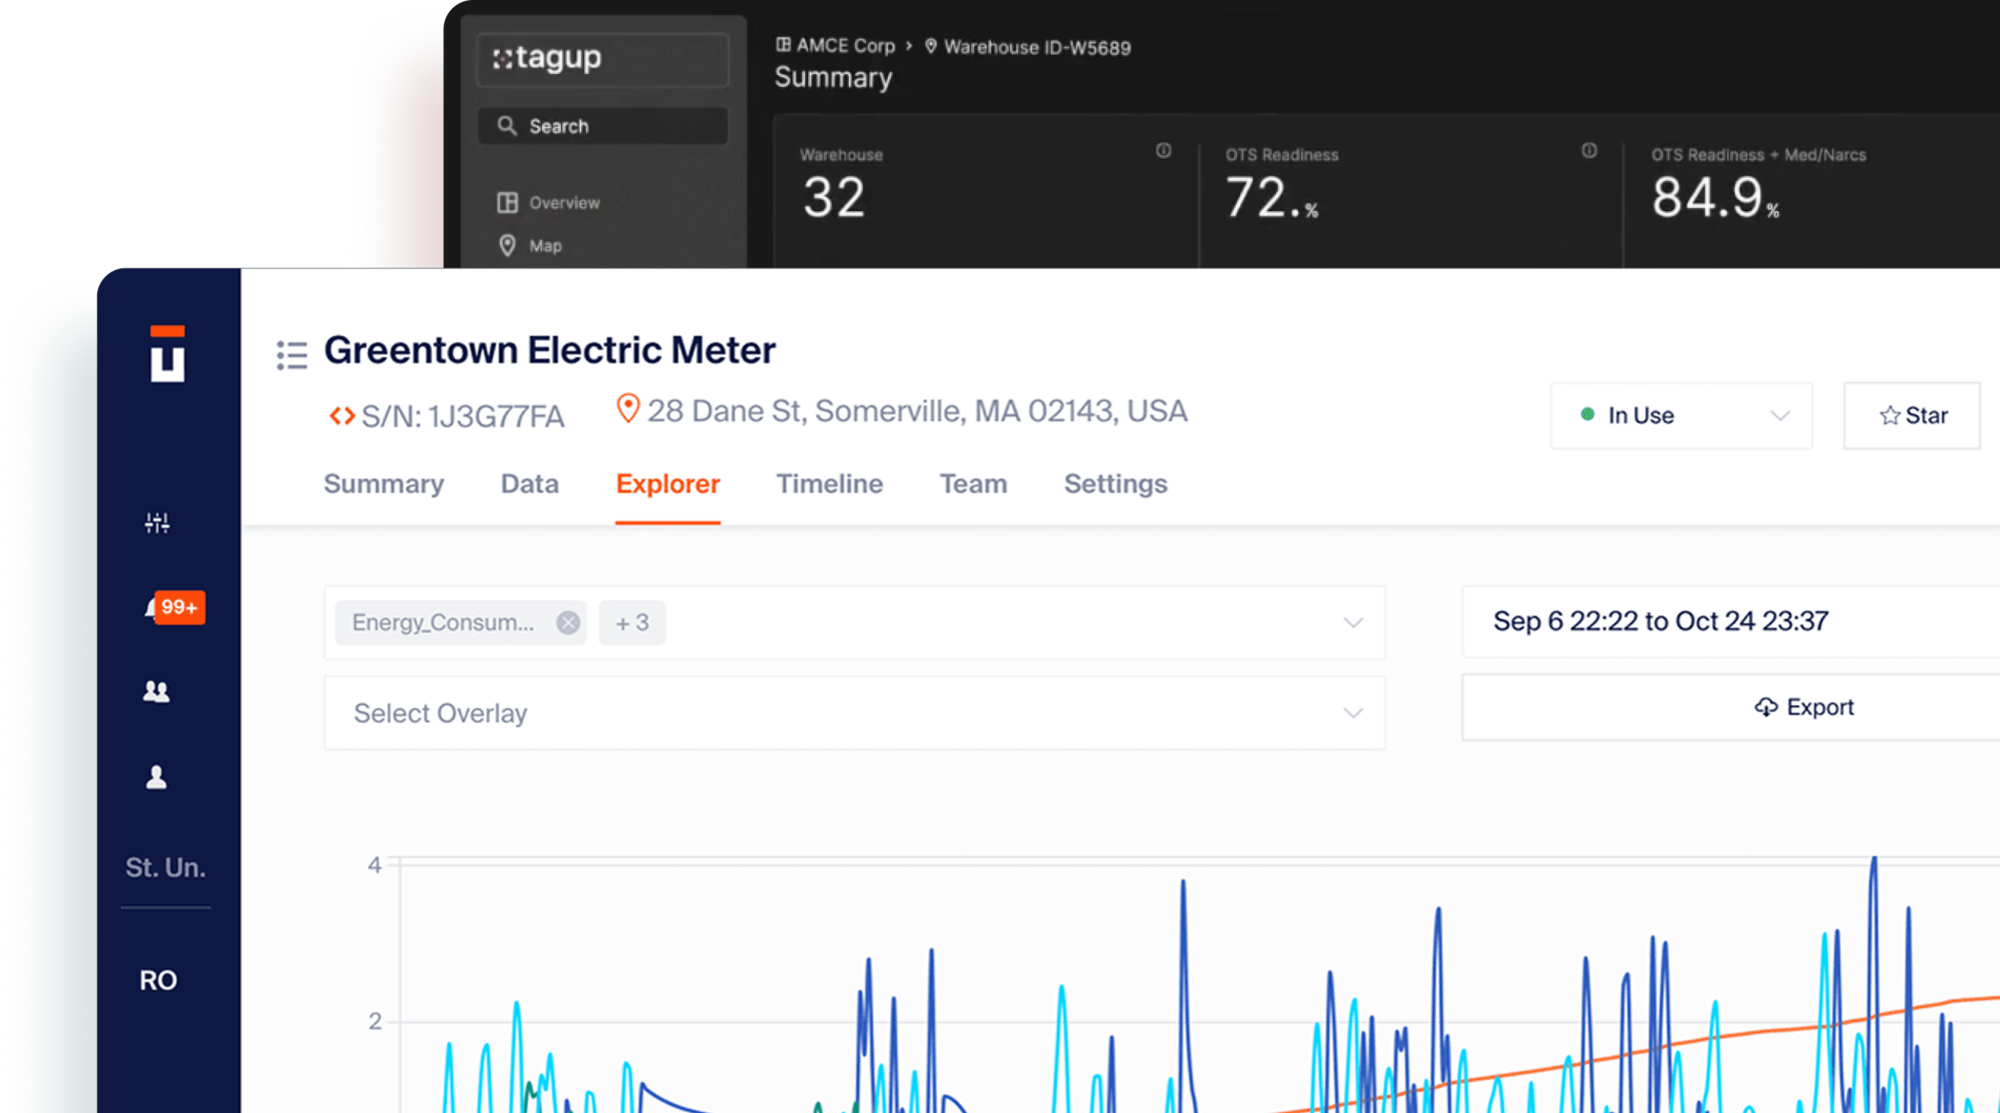
Tagup monitors industrial equipment around the world with one mission — predict downtime and failures before they happen. The engagement started after Jon, Tagup's CEO, found our open-source Vue.js work on GitHub and reached out for an extra pair of hands to push their frontend to the next level.

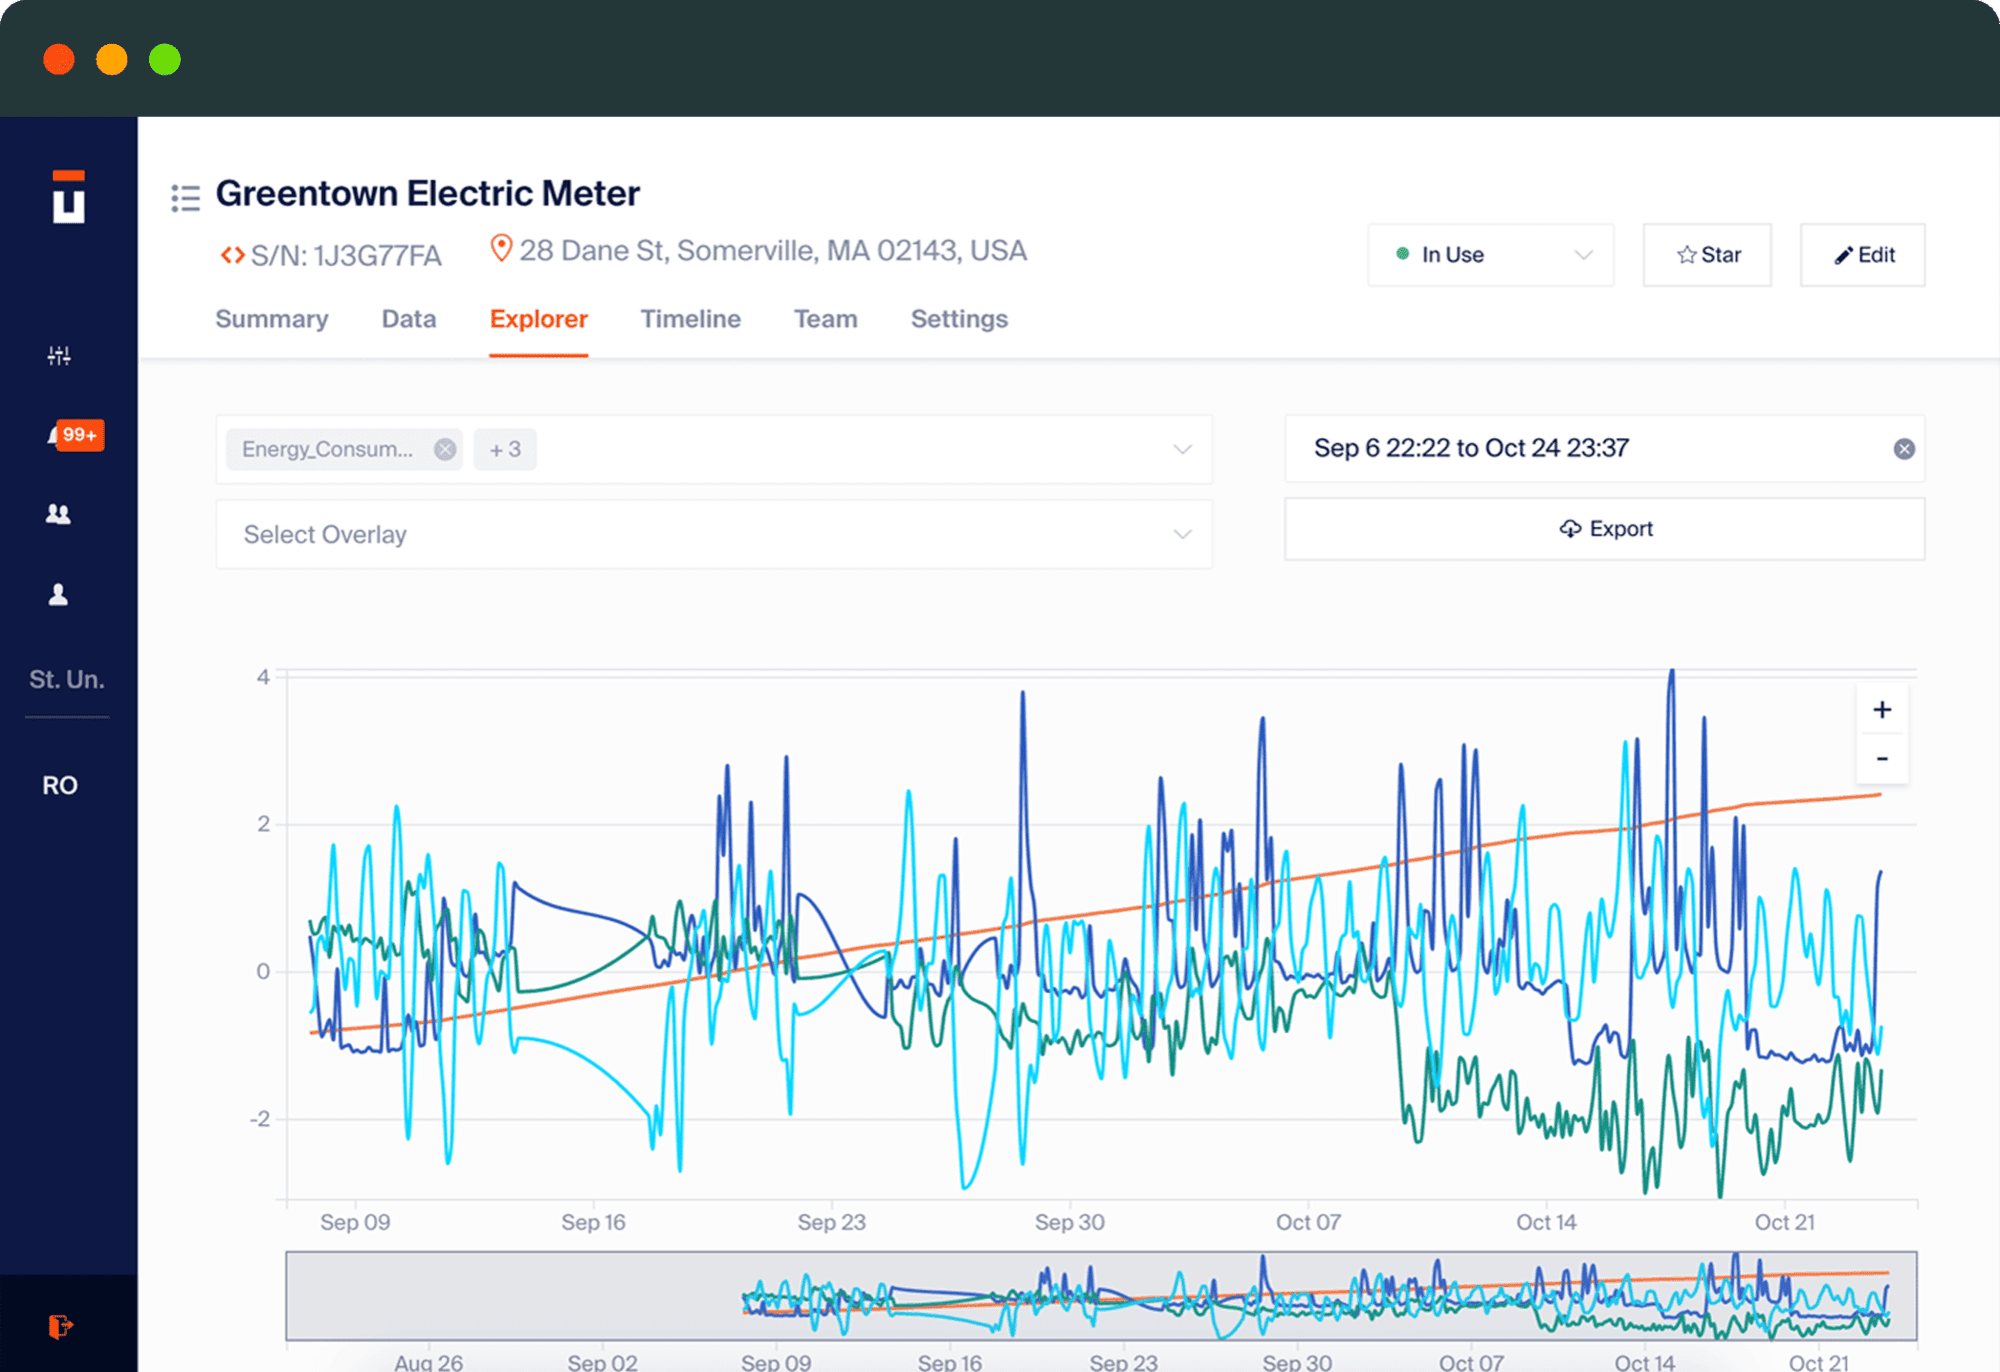
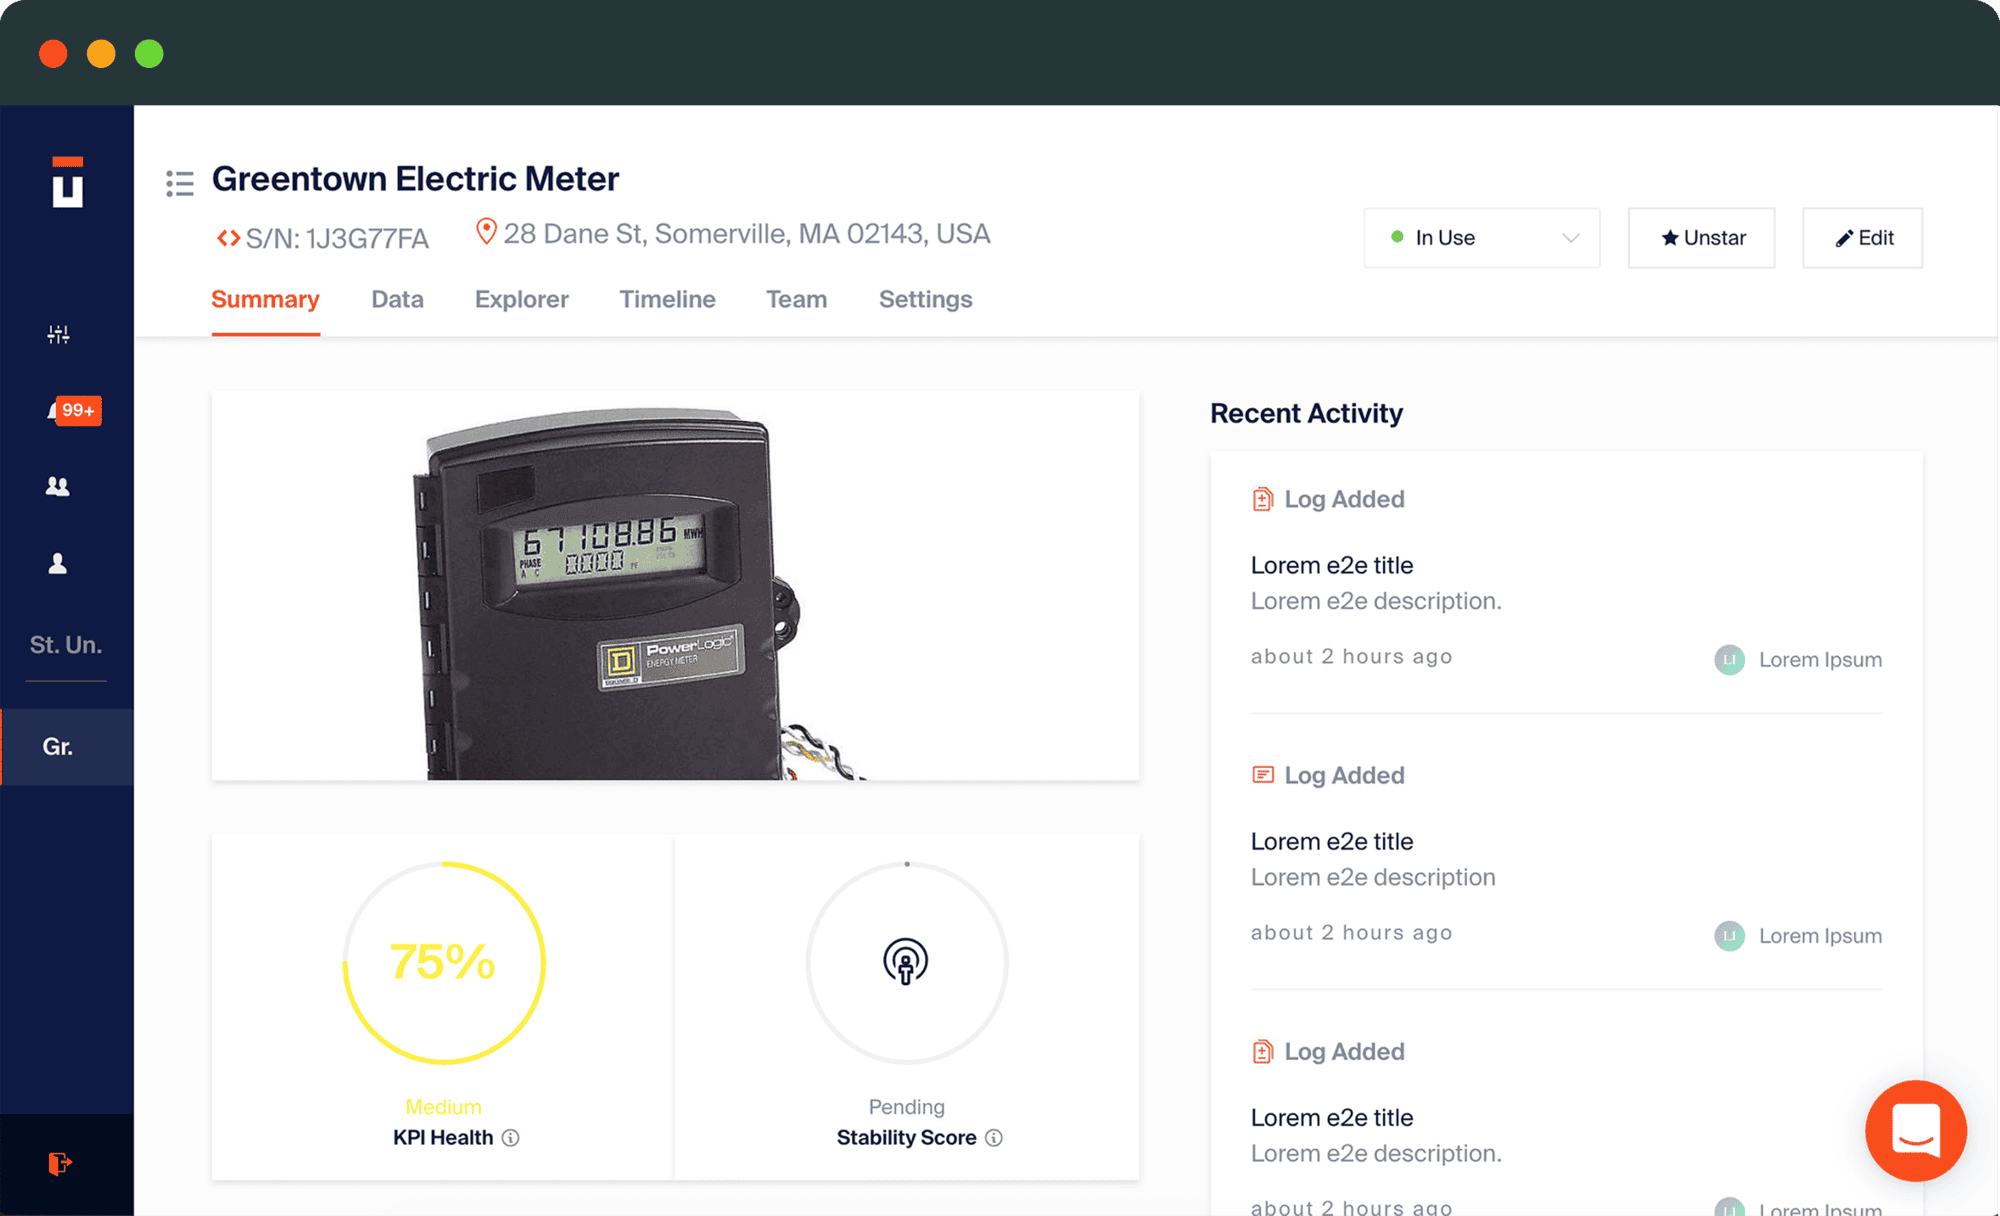
By that point Tagup already had monitoring hardware in place across multiple equipment companies, but the team was struggling to surface all that sensor data in a way engineers could actually act on. Live readings, organisational hierarchies, asset history, and model predictions all needed to live in a single, fast interface.

We came in to build a responsive Vue.js single-page app and to support the existing Node.js backend. We knew from day one that the MVP had to ship quickly without compromising on stability — that meant robust real-time plumbing, clean data structures, and serious test coverage from the start.

How We Built It

The Process

The work split naturally into two overlapping tracks — architecting the Vue.js single-page app and wiring up the real-time data layer on top of Socket.io and D3.js. Frontend ownership stayed with us throughout, with steady contributions back into the Node.js backend wherever the frontend needed it to flex.

Tagup real-time sensor charts and equipment overview

Phase 2

Real-Time Data Layer

We integrated Socket.io end-to-end and built the visualisation layer on top of D3.js, so live sensor data, organisation views, asset management, and historical readings could all flow into the UI as they happened. Charts updated continuously without the page jittering or stalling under load.

Socket.io D3.js

Real-Time · Data Visualisation

Tagup equipment monitoring dashboard

Phase 1

Architecting the SPA

We laid down the foundation of a fast, responsive Vue.js single-page app — routing, state, data fetching, and the component patterns the rest of the platform would build on. The architecture was sized for engineers who'd spend hours a day in the tool, jumping between assets, organisations, and historical views without waiting on full page loads.

Vue.js SPA Architecture

Frontend · Architecture

Scope & Deliverables

What We Did

  • Vue.js Single-Page App
  • Real-Time Charts
  • Asset Management UI
  • Node.js Backend Support

Frontend Partnership for an IoT Platform

Tagup found us through our open-source Vue.js work on GitHub and asked us to take their frontend to the next level. We joined as the frontend specialists in their team — owning the Vue.js SPA, integrating it with the existing Node.js backend, and contributing back into that backend wherever the product needed it.

We integrated Socket.io with real-time charts that streamed live data straight from sensors, built out user organisations, asset management screens, and historical asset views, and brought both the frontend and the backend to a stable development phase with strong test coverage, clean code, and predictable data structures.

Technologies & Services

Our Tech Stack

Vue.js on the frontend, Node.js on the backend, with Socket.io carrying real-time sensor streams and D3.js powering the charts engineers spent most of their day looking at. Every choice was made with one constraint in mind — keep the UI fast and responsive even when data is flowing in non-stop.

  • Frontend-Led
  • Real-Time
Vue.js Vue.js
Node.js Node.js
D3.js D3.js

Real-Time Data Visualisation

D3.js charts that update continuously as sensor data flows in, designed so engineers can scan dozens of signals at a glance without losing the detail when they zoom in.

Socket.io Integration

End-to-end real-time plumbing connecting sensor streams to the UI — live equipment data, asset state, and prediction signals delivered as they happen, without manual refreshes.

Test Coverage & Stability

Strong test coverage on both Vue.js and Node.js sides, plus the refactors and cleanup needed to bring the platform to a stable, maintainable development phase the in-house team could keep building on.

Measurable Impact

The Results

The Vue.js SPA we built gave Tagup's customers live access to equipment data and predictions in a fast, responsive interface. Within a few clicks engineers could move between organisations, drill into individual assets, and see real-time signals next to historical readings. The platform was picked up by engineers and teams across multiple equipment companies worldwide, and both the frontend and the supporting Node.js backend reached a stable development phase with strong test coverage, clean code, and predictable data structures the in-house team could keep building on.

Worldwide Engineers and teams using the platform
Real-Time Sensor data streamed end-to-end via Socket.io
High Test coverage across Vue.js & Node.js
Trusted By Teams Building The Future
Portrait of Jon Garrity
“BinarCode provides timely, high-quality code and development work. Their team is not only extremely efficient and productive but also easy to work with and highly communicative, overall. They continue to represent some of the strongest development staff on the company's team.”

Jon GarrityCEO, Tagup

Ready to build something that lasts?

Bring your idea, your challenge, or just a rough brief. We'll help you figure out the rest.